The Task Manager allows administrators to view and manage all existing tasks that have been generated from schedule executions. Unlike the schedule tools (Publications, Alerts, and so on), the Task Manager is a global view of all tasks, regardless of the source generation. It offers admins a birds-eye view of what has run, what is running and what tasks are in queue, awaiting execution.
Task List
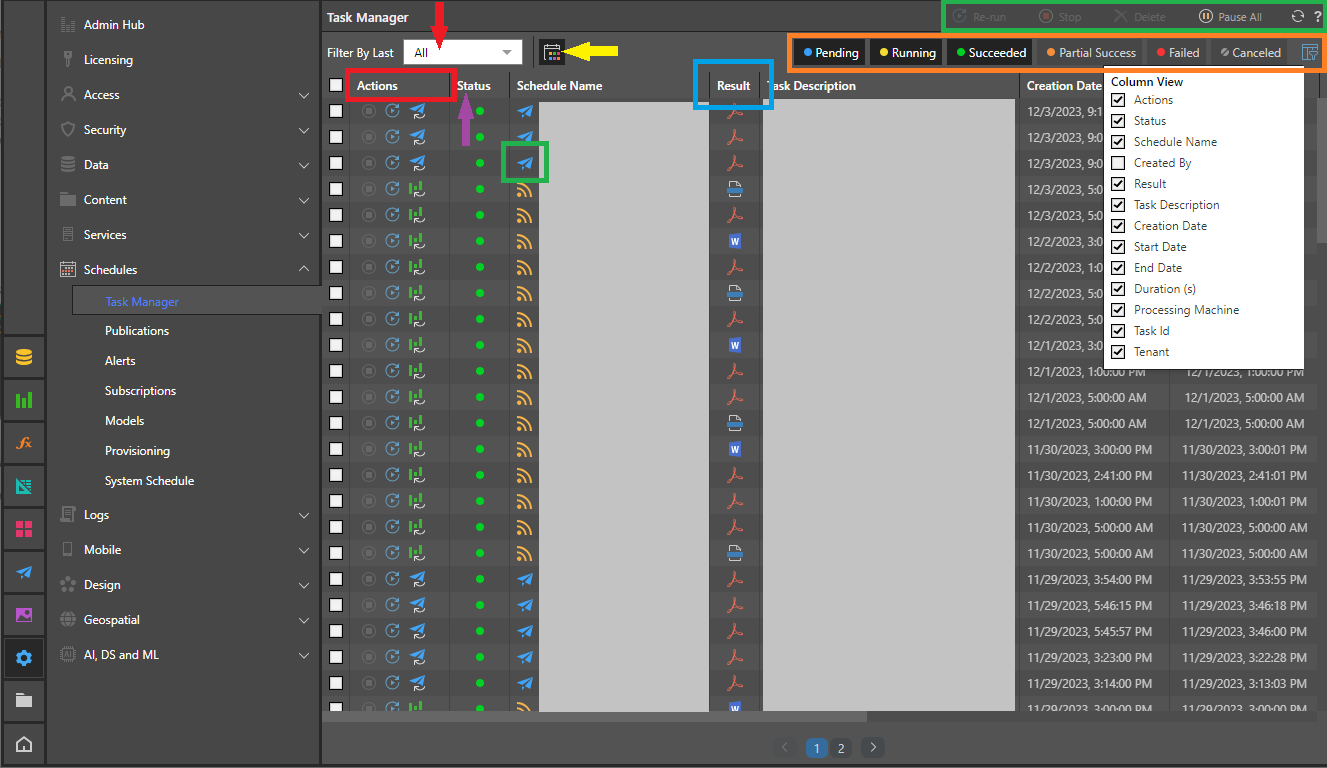
The primary role of the task manager is to provide a list of all tasks that have been run, are running, or are in a queue waiting to be run. The task list columns are:
- Actions - Actions that can be applied to the specific task. Typically, stop schedule, re-run, and go to item with an icon indicating the item type. The list may change depending on the task type.
- Status - The task's current processing status (see below).
- Schedule Name - The name of the schedule that generated the tasks. This includes an indicator of the type of schedule that generated the task (green box).
- Created By - (Not shown.) The name of the user who created the task.
- Result - If the task produces content (like printed documents or alert results), an icon shows the type of result. If there is no output, the field is empty.
- Description - Specific details about the given task (this may change depending on the type of task).
- Creation Date - The date and time the task was added to the queue.
- Start Date - The date and time the task's processing began.
- End Date - The date and time the task's processing stopped.
- Duration - The time (in seconds) to process the task.
- Processing machine - The task service that processed the task.
- Task ID - A unique identifier for the task. Note: The task ID can be used to find the task.
Important: The task list does NOT auto-update. Click Refresh in the top-right corner to update the list.
Task Filters
To better help admins view this list (which can be quite extensive), the manager comes with several filter options:
Filter by Last
Use the filter by last button (green arrow) to view tasks within a certain period:
- Select a <time period> to include tasks that started between now and that selected time (between 1 minute and 12 months ago).
- Select All to include all tasks.
- Select Custom to include tasks that started within a specific custom period. Start and End Date fields let you supply the details of your custom time period when this option is selected.
Filter by Type
Use the type filter button (yellow arrow), to pick tasks by their parent schedule type. Can be one of:
- Publications - Tasks created by schedules generated from Publish content and templates.
- Alerts - Data alerts created by users from Discover or Present content.
- Subscriptions - Automated content subscriptions created by users against Discover or Present content.
- Models - Tasks created by schedules generated from Model definitions.
- Printing - Any live print jobs submitted by users from the application (Discover, Present, Publish, Model).
- Live Model Processing - Any live processing of Model ETL or data modeling jobs.
- System - All back-end tasks created by the system (such as log cleaning, provisioning, image snapshots, and so on).
Filter by Status
Use these six filter buttons (orange box) to choose which tasks to see, based on their current status. Statuses can be:
- Pending (Blue) - Pending tasks in the system that are queued for processing.
- Running (Yellow) - Tasks currently being processed.
- Succeeded (Green) - Complete tasks that were 100% successful.
- Partial Success (Orange) - Completed tasks that were partially successful.
- Failed (Red) - Completed tasks that were 100% unsuccessful
- Canceled (Gray)- tasks that have been canceled or stopped.
There is also a Column View button. Use this to include or exclude particular columns in the table of results.
Sort and Filter
Most column headers include options to sort and filter the results:
- Hover over a column header to Sort the results by ascending or descending order.
- Hover over a column heading to open the Filter options. Filtering allows you to limit the results shown in the column by value. Click the filter icon associated with your column, specify the details of your filter, and click Apply. Which details you see depends on the data type of the value in the selected column:
- If the column contains a Date / time you can select from the options:
- Equals - Return logs with the selected date and time.
- Before - Return logs up to the selected date and time.
- After - Return logs after the selected date and time.
- Between - Return logs within a particular date and time window. In this case, you need to specify the start and end date for your filter.
- If the column contains a Number you can select from the options: Equals, Not Equals, Greater than, Greater than or Equals, Less than, Less than or equals, and specify a comparison value.
- If the column contains a String you can select from the options: Equals, Does Not Equal, Start with, End with, Contain, Does not contain, and specify a comparison value.
Pagination
Where there are more results than fit on a single page, a set of pagination controls opens underneath the table of results. You can use these controls to:
- See how many pages of results there are.
- Move between the pages of results.
- Go directly to a specific page of results.
Actions
A variety of actions are available in each row of the task list.
- For each task: In the actions panel for each task (yellow box above), admins can stop a task from running, re-run a completed task, or jump to the content item that drives the task's schedule or content.
- For multiple tasks: Selecting the checkboxes for one or more tasks, admins can use the meta action buttons (green) to delete, stop, or re-run the collection of tasks selected.
Pausing Task Processing
The Pause All button (green box above), will pause the task engines from processing any tasks. This state is persisted until an administrator restarts the system. Note:
- Pause All will stop any tasks currently processing.
- Print jobs, live model processing and system jobs are all paused by the pause all function.
Messages
When a row is selected in the top panel (in the Task list), any message associated with that task is shown in the bottom Messages panel and can be copied using the Copy to Clipboard option. Hide this panel using the Minimize option (blue arrow).